Difference between revisions of "Kibana setup"
| (9 intermediate revisions by the same user not shown) | |||
| Line 3: | Line 3: | ||
=Installation= | =Installation= | ||
| + | |||
| + | ==Get Kibana== | ||
Download the latest version of Kibana: http://www.elasticsearch.org/overview/kibana/installation/ | Download the latest version of Kibana: http://www.elasticsearch.org/overview/kibana/installation/ | ||
| Line 19: | Line 21: | ||
| − | = | + | ==Kibana root configuration== |
| − | |||
| − | |||
| − | |||
| − | + | Set the "elasticSearch" URL. | |
<syntaxhighlight lang="bash"> | <syntaxhighlight lang="bash"> | ||
| Line 31: | Line 30: | ||
</syntaxhighlight> | </syntaxhighlight> | ||
| − | Adjust '''elasticSearch''' value, ~ line 32. | + | |
| + | Adjust and replace '''elasticSearch''' value, ~ line 32. | ||
| + | |||
| + | <syntaxhighlight lang="javascript"> | ||
| + | elasticsearch: 'http://' + window.location.hostname + ':9200', | ||
| + | </syntaxhighlight> | ||
| − | + | !!! IMPORTANT !!! You MUST not use a hard-coded IP @ in that ''elasticsearch'' string! | |
| − | + | Special thanks to my collegue [https://www.linkedin.com/in/julienrialland Julien Rialland] for this part! :) | |
| − | |||
| − | |||
| − | |||
| − | |||
| − | |||
| − | =Apache2 configuration= | + | ==Apache2 configuration== |
Either you create a new configuration or your update a VirtualHost configuration. | Either you create a new configuration or your update a VirtualHost configuration. | ||
| − | |||
Like Zabbix does, I chose to use a configuration for kibana rather than a VHost change. | Like Zabbix does, I chose to use a configuration for kibana rather than a VHost change. | ||
| Line 79: | Line 77: | ||
| − | Enable configuration: | + | Enable Apache2 configuration: |
<syntaxhighlight lang="bash"> | <syntaxhighlight lang="bash"> | ||
| Line 87: | Line 85: | ||
| − | Access the Kibana web page on http://192.168.1.203/kibana | + | |
| + | =Test installation (1st run)= | ||
| + | |||
| + | Source: http://www.elasticsearch.org/guide/en/kibana/current/using-kibana-for-the-first-time.html | ||
| + | |||
| + | |||
| + | '''Create fake data and import it into ElastiSearch''' | ||
| + | |||
| + | <syntaxhighlight lang="bash"> | ||
| + | curl -XPUT http://localhost:9200/shakespeare -d ' | ||
| + | { | ||
| + | "mappings" : { | ||
| + | "_default_" : { | ||
| + | "properties" : { | ||
| + | "speaker" : {"type": "string", "index" : "not_analyzed" }, | ||
| + | "play_name" : {"type": "string", "index" : "not_analyzed" }, | ||
| + | "line_id" : { "type" : "integer" }, | ||
| + | "speech_number" : { "type" : "integer" } | ||
| + | } | ||
| + | } | ||
| + | } | ||
| + | } | ||
| + | '; | ||
| + | |||
| + | wget http://www.elasticsearch.org/guide/en/kibana/current/snippets/shakespeare.json | ||
| + | |||
| + | curl -XPUT localhost:9200/_bulk --data-binary @shakespeare.json | ||
| + | </syntaxhighlight> | ||
| + | |||
| + | |||
| + | |||
| + | '''Display data''' | ||
| + | |||
| + | * Access the Kibana web page on http://192.168.1.203/kibana | ||
| + | * Go to the ''sample dashboard'' | ||
| + | |||
| + | [[File:Kibana intro.png|link=http://www.elasticsearch.org/guide/en/kibana/current/tutorials/intro/intro.png|none|Kibana intro]] | ||
| + | Image: ElasticSearch | ||
| + | |||
| + | |||
| + | * If you see anything: Kibana is working good with your ElasticSearch!! :) | ||
| + | |||
| + | [[File:Kibana sample shakespeare.png|link=http://www.elasticsearch.org/guide/en/kibana/current/tutorials/intro/sample_shakespeare.png|none|Kibana demo]] | ||
| + | Image: ElasticSearch | ||
| + | |||
| + | |||
| + | |||
| + | '''More guidelines''' | ||
| + | |||
| + | |||
| + | Check-out the official ElasticSearch website: http://www.elasticsearch.org/guide/en/kibana/current/using-kibana-for-the-first-time.html | ||
| + | |||
| + | |||
| + | |||
| + | |||
| + | =Setup dashboards= | ||
| + | |||
| + | Now you can either customize the dashboard or set the logstash view as default. | ||
| + | |||
| + | |||
| + | ==Set logstash dashboard as default== | ||
| + | |||
| + | To set the logstash dashboard as default, just do: | ||
| + | |||
| + | <syntaxhighlight lang="bash"> | ||
| + | cd /opt/kibana/app/dashboard | ||
| + | cp default.json default.json.backup | ||
| + | cp logstash.json default.json | ||
| + | </syntaxhighlight> | ||
If you haven't configure Logstash yet you should see an empty page! :-) | If you haven't configure Logstash yet you should see an empty page! :-) | ||
| + | |||
| + | |||
| + | |||
| + | |||
| + | =Bug fixes= | ||
| + | |||
| + | ==Connection time-out== | ||
| + | |||
| + | You might encounter some ''Netty connection time-out'' error... :S That might be due to a wrong config.js ... You should try to put Kibana on another computer and debug from it. | ||
| + | |||
| + | |||
| + | |||
| + | |||
| + | =References= | ||
| + | |||
| + | * Official documentation: http://www.elasticsearch.org/guide/en/kibana/current/using-kibana-for-the-first-time.html | ||
Latest revision as of 10:58, 29 January 2015
Contents
Installation
Get Kibana
Download the latest version of Kibana: http://www.elasticsearch.org/overview/kibana/installation/
By the time of this writting, latest release is v3.1.2
cd /opt
wget https://download.elasticsearch.org/kibana/kibana/kibana-3.1.2.zip
unzip kibana-3.1.2.zip
rm kibana-3.1.2.zip
ln -s /opt/kibana-3.1.2 /opt/kibana
Kibana root configuration
Set the "elasticSearch" URL.
cp /opt/kibana/config.js /opt/kibana/config.js.backup
vim /opt/kibana/config.js
Adjust and replace elasticSearch value, ~ line 32.
elasticsearch: 'http://' + window.location.hostname + ':9200',
!!! IMPORTANT !!! You MUST not use a hard-coded IP @ in that elasticsearch string!
Special thanks to my collegue Julien Rialland for this part! :)
Apache2 configuration
Either you create a new configuration or your update a VirtualHost configuration. Like Zabbix does, I chose to use a configuration for kibana rather than a VHost change.
cd /etc/apache2/conf-available
vim kibana.conf
Put the following content:
# Kibana application
<IfModule mod_alias.c>
    Alias /kibana /opt/kibana
</IfModule>

<Directory "/opt/kibana">
    Options FollowSymLinks
    Require all granted

    php_value max_execution_time 300
    php_value memory_limit 128M
    php_value post_max_size 16M
    php_value upload_max_filesize 2M
    php_value max_input_time 300
    php_value date.timezone Europe/Stockholm
</Directory>
Enable Apache2 configuration:
a2enconf kibana
service apache2 reload
Test installation (1st run)
Source: http://www.elasticsearch.org/guide/en/kibana/current/using-kibana-for-the-first-time.html
Create fake data and import it into ElastiSearch
curl -XPUT http://localhost:9200/shakespeare -d '
{
 "mappings" : {
  "_default_" : {
   "properties" : {
    "speaker" : {"type": "string", "index" : "not_analyzed" },
    "play_name" : {"type": "string", "index" : "not_analyzed" },
    "line_id" : { "type" : "integer" },
    "speech_number" : { "type" : "integer" }
   }
  }
 }
}
';

wget http://www.elasticsearch.org/guide/en/kibana/current/snippets/shakespeare.json

curl -XPUT localhost:9200/_bulk --data-binary @shakespeare.json
Display data
- Access the Kibana web page on http://192.168.1.203/kibana
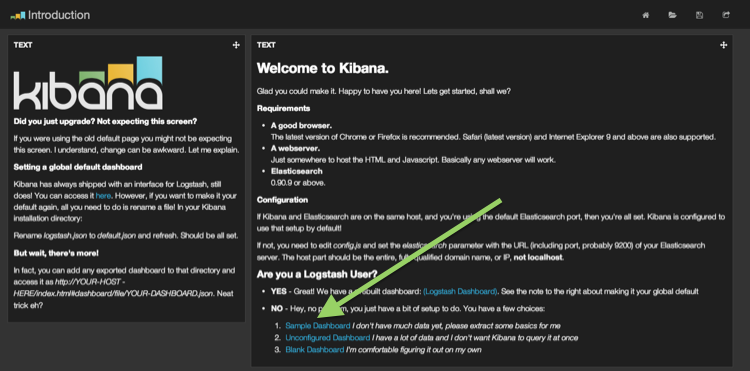
- Go to the sample dashboard
Image: ElasticSearch
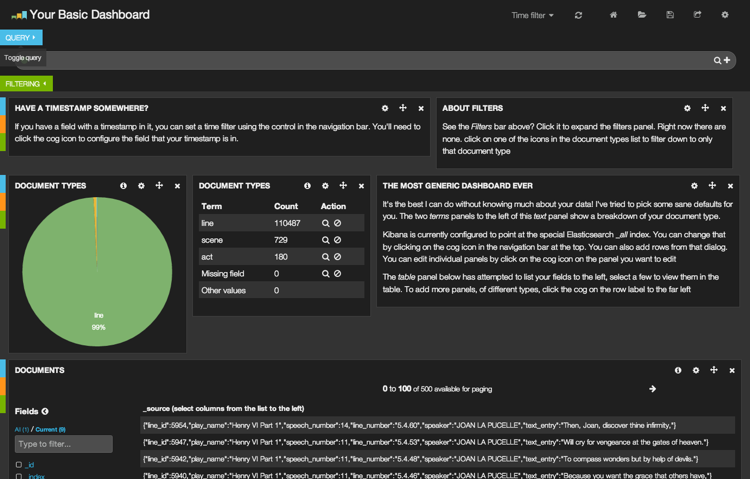
- If you see anything: Kibana is working good with your ElasticSearch!! :)
Image: ElasticSearch
More guidelines
Check-out the official ElasticSearch website: http://www.elasticsearch.org/guide/en/kibana/current/using-kibana-for-the-first-time.html
Setup dashboards
Now you can either customize the dashboard or set the logstash view as default.
Set logstash dashboard as default
To set the logstash dashboard as default, just do:
cd /opt/kibana/app/dashboard
cp default.json default.json.backup
cp logstash.json default.json
If you haven't configure Logstash yet you should see an empty page! :-)
Bug fixes
Connection time-out
You might encounter some Netty connection time-out error... :S That might be due to a wrong config.js ... You should try to put Kibana on another computer and debug from it.
References
- Official documentation: http://www.elasticsearch.org/guide/en/kibana/current/using-kibana-for-the-first-time.html

